
Engineering Reference of Flow
You will find a listing of various water using fixtures and how to estimate the probable demand in residential properties, office buildings, schools, motels and hotels, shopping centers, and many other customers. In order to properly select water conditioning equipment, it is essential to determine flow demands. The recording of actual installations by the use of special meters and recording charts enables us to use the information as an excellent reference tool.* The following graphs and data are the result of such research conducted by the AWWA.
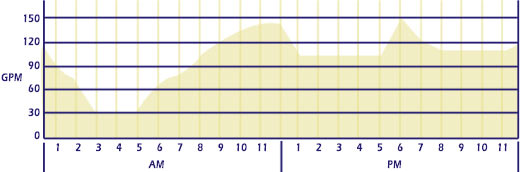
- Hotels and Motels Hotels and motels are subject to wide fluctuations in water use, with peak periods of short duration. The example of a 216 room hotel had a maximum demand of 150 GPM, or 0.7 GPM/unit, which occurred at one time during the 24 hour period. The graph below represents the result of a recorded survey on a Texas hotel.
- Schools Flush valves with high flow requirements are normally used for sanitary purposes, and schools usually operate with uniform recess periods, both of which produce extreme water-flow-rate demands. Test results from a South Texas modern high school with 1390 students demonstrated the need to properly size equipment for these types of applications. In this particular application flows of 150 GPM were common, with peak demands reaching 210 GPM on many occasions.
- Apartments Apartments, like hotels have wide variations in flow rates as shown below. The survey conducted illustrates the flows throughout a one week period.
*Utility engineers have used a wide variety of methods to estimate a customers peak water demand, which range from a rule of thumb procedure to detailed criteria. The information here has been taken from field experiments, utility surveys, technical publications, and hydraulic design methods, all of which are assembled into a condensed explanation of customer demand and how to determine the maximum flows that can be expected. The majority of the contents within this publication have been extracted from the American Water Works Association (AWWA) Manual M-22. In determining demands of commercial applications, professional engineering information and on site experience are essential in final analysis of determining probable flows. The AWWA manual lends this design experience to efficiently calculate flow demands in commercial applications.
| SUN | MON | TUES | WED | THUR | FRI | SAT | |
| MIDNIGHT | 10 | 10 | 10 | 10 | 10 | 10 | 10 |
| 6:00 AM | 25 | 50 | 30 | 30 | 45 | 35 | 30 |
| NOON | 35 | 90 | 45 | 80 | 90 | 85 | 35 |
| 6:00 PM | 30 | 40 | 45 | 30 | 30 | 30 | 30 |
Plumbing Fixtures Values
The following represents each individual fixture value as if each fixture was operated independently at 35 PSI inlet pressure. A bathtub for example flows at a rate of 8 GPM without any interference from other fixtures. As more fixtures are present, the probability of flow decreases. When encountering devices or fixtures not listed, the demand in gallons per minute should be determined and added to the total fixture count.
| Fixture Type | Fixture Value Based on 35 PSI Inlet Fixture Type Pressure | |
| Bathtub Arrangement | 8 | |
| Bedpan Washers | 10 | |
| Combination Sink and Tray | 3 | |
| Dental Unit | 1 | |
| Dental Lavatory | 2 | |
| Drinking Fountain (cooler) | 1 | |
| Drinking Fountain (public) | 2 | |
| Kitchen Sink: | 1/2″connection | 3 |
| 3/4″ connection | 7 | |
| Lavatory: | 3/8″ connection | 2 |
| 1/2″ connection | 4 | |
| Lavatory Tray: | 1/2″ connection | 3 |
| 3/4″ connection | 7 | |
| Shower Head (shower only) |
4 |
|
| Service Sink: | 1/2″. connection | 3 |
| 3/4″ connection | 7 | |
| Urinal: | Pedestal Flush Valve | 35 |
| Wall or Stall | 12 | |
| Wash Sink: (each set of faucets) | 4 | |
| Water Closet: | Flush Valve | 35 |
| Tank Type | 3 | |
| Dishwasher: | 1/2″ connection | 4 |
| 3/4″ connection | 10 | |
| commercial (nominal) | 15 | |
| Washing Machine: | 1/2″ connection | 5 |
| 3/4″ connection | 12 | |
| 1″ connection | 25 | |
| 1-1/4″ connection | 35 | |
| 1-1/2″ connection | 50 | |
| Hose (50 ft. length wash down): | 1/2″ | 6 |
| 5/8″ | 9 | |
| 3/4″ | 12 | |
| 1″ | 25 | |
| Variations in Flows with a 50 Foot Garden Hose | |
| Water Pressure PSI | Flow GPM |
| 10 | 7 |
| 20 | 9 |
| 30 | 11 |
| 40 | 13 |
| 50 | 15 |
| 70 | 18 |
| 100 | 22 |
Due to the variation illustrated above, compensation must be applied when calculating the flow demand on any application. Multiplication factors must be applied upon completion of converting fixture value to probable GPM flow. The chart in Figure A should be used for this important adjustment. Example: A probable demand of 50 GPM was determined. The application has an inlet pressure of 60 PSI. Using the chart below, a multiple factor of 1.34 should be used. 50 GPM x 1.34 = 67 GPM compensated flow demand.
| Figure A | |
| Pressure PSI | Factor |
| 20 | 0.74 |
| 30 | 0.92 |
| 35 | 1.00 |
| 40 | 1.07 |
| 50 | 1.22 |
| 60 | 1.34 |
| 70 | 1.46 |
| 80 | 1.57 |
| 90 | 1.68 |
| 100 | 1.78 |
*Charts are based on inlet pressure of 35 PSI. For other pressures, adjust by use of Figure A.
| Figure B *Fixture Value Conversion Charts | ||||
|
Chart I Country Clubs, Hospitals, Hotels, Nursing Homes, Office Buildings, Shopping Centers, Schools, Restaurants |
Chart II Apartments, Condominiums, Dormitories, Trailer Parks, Homes, Motels |
|||
| Fixture Value | Probable GPM Flow | Fixture Value | Probable GPM Flow | |
| 10 | – | 10 | 10 | |
| 20 | – | 20 | 18 | |
| 25 | – | 25 | 20 | |
| 40 | – | 40 | 21 | |
| 50 | 35 | 50 | 22 | |
| 75 | 43 | 75 | 23 | |
| 100 | 50 | 100 | 24 | |
| 125 | 55 | 125 | 26 | |
| 150 | 57 | 150 | 28 | |
| 200 | 62 | 200 | 30 | |
| 250 | 67 | 250 | 33 | |
| 300 | 72 | 300 | 37 | |
| 350 | 77 | 350 | 39 | |
| 400 | 82 | 400 | 42 | |
| 450 | 86 | 450 | 44 | |
| 500 | 90 | 500 | 46 | |
| 550 | 94 | 550 | 50 | |
| 600 | 98 | 600 | 52 | |
| 650 | 102 | 650 | 54 | |
| 700 | 106 | 700 | 56 | |
| 750 | 110 | 750 | 58 | |
| 800 | 112 | 800 | 59 | |
| 900 | 117 | 900 | 61 | |
| 1,000 | 122 | 1,000 | 62 | |
| 1,100 | 127 | 1,100 | 64 | |
| 1,200 | 131 | 1,200 | 66 | |
| 1,300 | 133 | 1,300 | 68 | |
| 1,400 | 136 | 1,400 | 69 | |
| 1,500 | 138 | 1,500 | 70 | |
| 2,000 | 140 | 2,000 | 72 | |
| 3,000 | 156 | 3,000 | 76 | |
| 4,000 | 162 | 4,000 | 82 | |
| 5,000 | 168 | 5,000 | 88 | |
| 6,000 | 174 | 6,000 | 94 | |
| 7,000 | 180 | 7,000 | 100 | |
| 8,000 | 186 | 8,000 | 108 | |
| 9,000 | 192 | 9,000 | 116 | |
| 10,000 | 198 | 10,000 | 122 | |
| 11,000 | 204 | 11,000 | 128 | |
| 12,000 | 210 | 12,000 | 134 | |
| 13,000 | 216 | 13,000 | 140 | |
The following is an example of estimating the probable GPM demand for an apartment complex. Customer: 160 unit apartment complex pressure at meter: 50 PSI
| Fixture | Fixture Value | Extended Fixture Values |
| 205 tank water closets | x 3 = | 615 |
| 259 lavatories: 3/8″ | x 2 = | 518 |
| 138 dishwashers: 1/2″ | x 4 = | 552 |
| 10 washing machines: 1/2″ | x 5 = | 50 |
| 165 kitchen sinks: 1/2″ | x 3 = | 495 |
| 162 bathtubs | x 8 = | 1296 |
| Total Fixture Value | 3526 | |
Fixture value: 3526 Conversion from Figure B, Chart II: 80 GPM Adjustment to 50 PSI inlet water pressure: 80 GPM x 1.22 = 97.6 GPM or 98 GPM. The probable peak demand therefore, in this example of a 160 unit apartment, would be 98 GPM.
- Apartments Based on 3 persons/apt. Hot and cold = 150 gal./unit/day Hot only = 60 gal./unit/day
- Barber Shops 55 gal./day/chair
- Beauty Salons 270 gal./day/station
- Boilers To determine daily makeup in gallons: 1. Multiply boiler h.p. by 4.25 2. Then multiply by hours per day of operation. 3. Then multiply by the % operating rating. 4. Then subtract the % condensate returns.Note: When ratings are given in pounds of steam per hour, divide by 500 to obtain GPM requirement. When ratings are given in BTU’s, divide by 12,000. For every 12,000 BTU’s, there is an equivalent of 1 h.p.
- Camps Day (no meals)= 15 gal./day/person Resorts = 50 gal./day/person Tourist = 35 gal./day/person
- Cooling Tower To determine daily makeup in gallons: 1. Multiply the tonnage by four (this includes 2 gal./day/hr./ton bleed off). 2. Then multiply by the number of hours per day of operation.
- Dentist 4,000 gal./month/chair
- Dormitories Hot and cold = 40 gal./person/day Hot only = 20 gal./person/day
- Hospitals Meter reading preferred Hot and cold = 250 gal./bed/day Hot only = 170 gal./bed/day
- Lawns 25 gal./square ft./season
- Laundry Hot and cold = 2.5 lb. capacity is equivalent to gallons per cycle.
- Livestock and Poultry Cow, beef = 12 gal./animal/day Cow, dairy = 20 gal./animal/day Goat = 2 gal./animal/day Hog = 12 gal./animal/day Horse = 12 gal./animal/day Mule = 12 gal./animal/day Sheep = 2 gal./animal/day Chickens = 10 gal./each 100/day Turkeys = 18 gal./each 100/day
- Motels Hot and cold = 130 gal./unit/day Hot only = 60 gal./unit/day
- Nursing Homes Hot and cold = 100 gal./bed/day Hot only = 50 gal./bed/day
- Office Buildings Hot and cold = 20 gal./person/day Hot only = 3 gal./person/day
- Restaurants Hot and cold = 15 gal./meal/day Hot only = 7 gal./meal/day Add on for bar or cocktail lounge = 2 gal./patron/day
- Schools Elementary:Hot and cold = 13 gal./stu./day Hot only = 5 gal./stu./day Jr. High: Hot and cold = 20 gal./stu./day Hot only = 10 gal./stu./day Sr. High: Hot and cold = 35 gal./stu./day Hot only = 15 gal./stu./day
- Shopping Centers 300 gal./day/1000 sq. ft.
- Trailer Parks 150 gal./trailer/day